The context
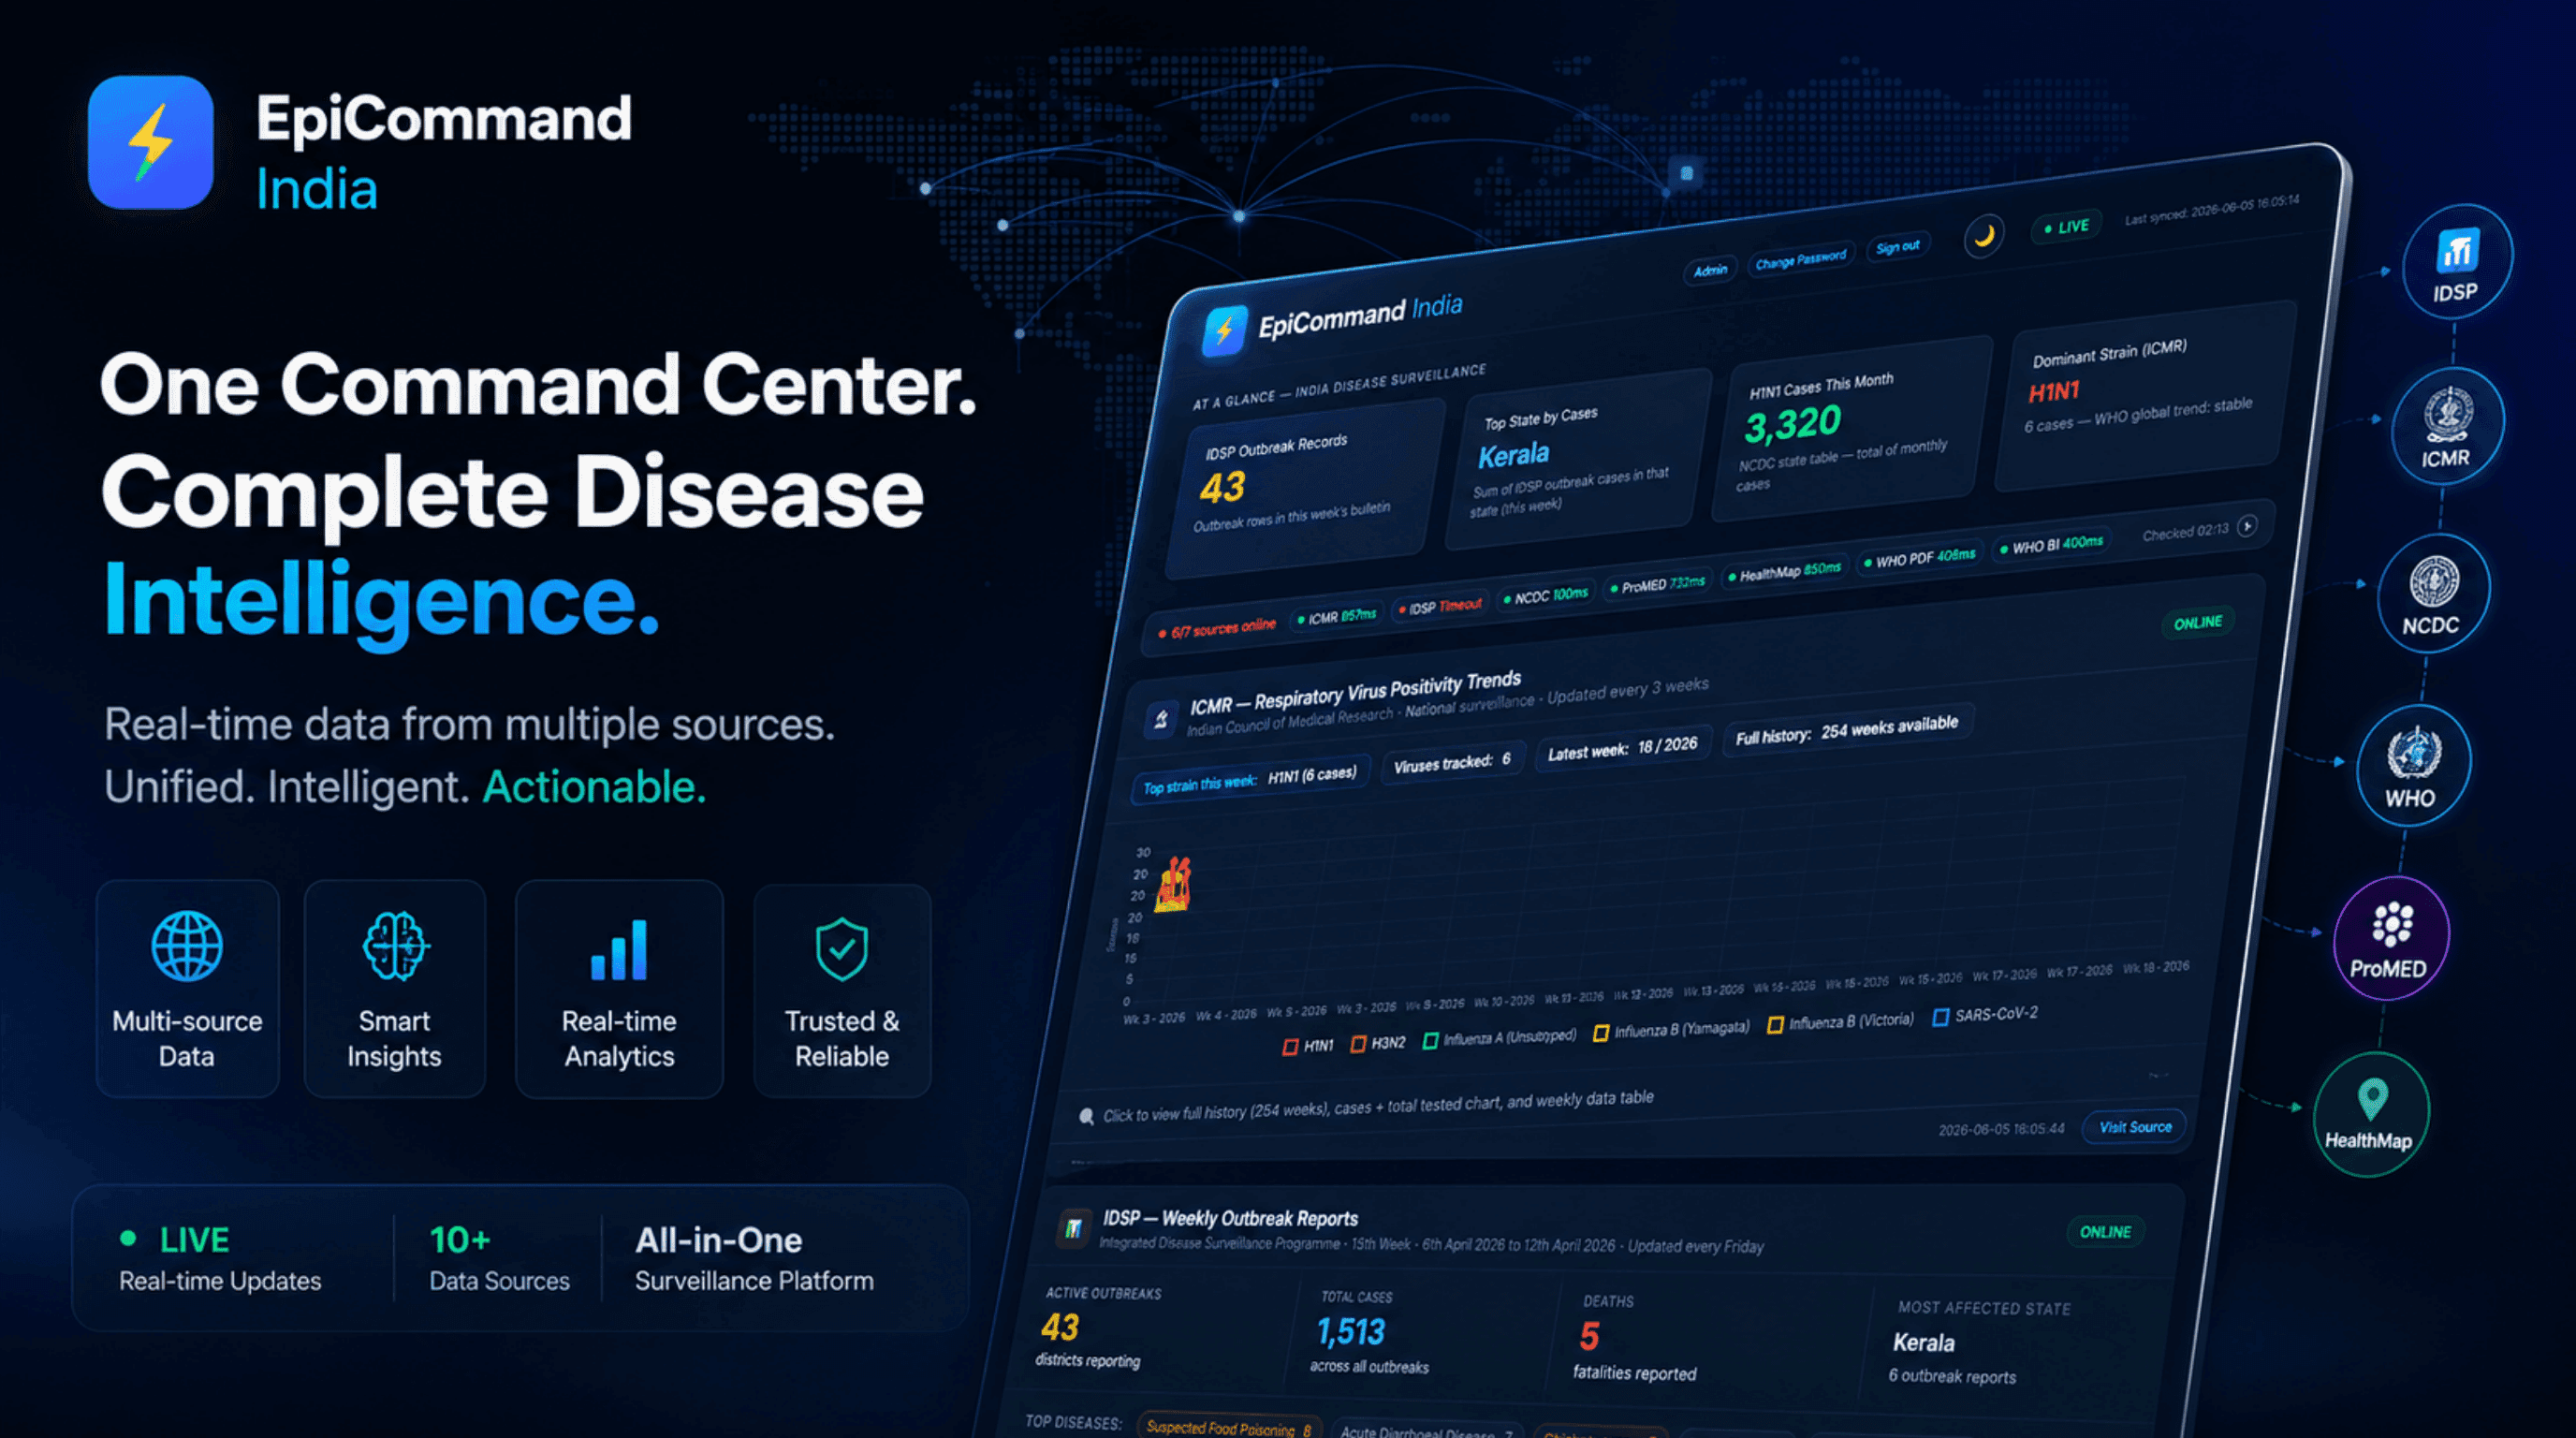
India's disease-surveillance data exists, but it is scattered across seven different places and formats. IDSP publishes weekly outbreak PDFs (some hosted on Google Drive), NCDC posts monthly H1N1 situation reports, ICMR runs a separate public flu dashboard, WHO issues weekly global PDFs, and ProMED and HealthMap stream global alerts. For a public-health analyst, keeping a single current picture meant visiting every site by hand, downloading files, and reconciling formats manually. Rian Infotech built EpiCommand India to turn that scattered collection into one always-current, access-controlled web dashboard.
The problem, precisely
Surveillance data lives in seven silos. Relevant outbreak intelligence is split across seven authoritative Indian and global sources (IDSP, NCDC, ICMR, WHO, ProMED, HealthMap, and the WHO SEARO GISRS Power BI embed), each with its own site, cadence, and data shape. There was no single screen that showed all of them together.
The formats fight back. Sources hide their data behind government PDFs (some server-hosted, some on Google Drive), an HTML dashboard with chart data embedded in JavaScript variables, JSON alert endpoints, and a Power BI 'publish to web' embed. Each demands a different extraction technique, and government PDFs add artefacts like mid-word line breaks that corrupt naive parsing.
Manual collection cannot be longitudinal. Visiting each site and eyeballing the latest chart gives you a snapshot, not a history. Building a queryable archive across weeks of IDSP outbreak reports or tracking which respiratory strain is circulating over a season is impractical by hand, slow, and error-prone.
One flaky source shouldn't blank the board. Indian government sites are slow or unreachable from overseas hosting, and any single source can fail on a given run. A naive pipeline that crashes or shows empty cards when one feed is down is not trustworthy enough for an operational intelligence tool.
What we built ✓ verified in code
A pluggable seven-source scraping pipeline
A Python registry of seven source-specific scrapers, each subclassing a common BaseScraper contract (fetch then parse then save_json) so adding a source is one file plus one registry line. The set spans requests plus BeautifulSoup and pdfplumber for the IDSP, NCDC, and WHO PDFs; a lightweight HTTP-plus-regex path for the ICMR dashboard; Playwright for ProMED and the Power BI embed; and a direct JSON-endpoint call for HealthMap. An orchestrator runs them all and writes one combined dataset.
Deep PDF and embed intelligence
The IDSP scraper resolves both direct and Google-Drive-hosted PDFs, validates magic bytes, extracts multi-page outbreak tables with a regex fallback, accumulates multi-row 'Action Taken' narratives, and repairs PDF line-break artefacts without merging real short words. The Power BI scraper walks every report page, captures the embed's own querydata network responses, and parses the compact DSR semantic-model payloads into year, week, and value rows with human-readable labels.
A longitudinal, queryable archive
Rather than just the latest snapshot, the platform builds history. IDSP runs in historical-backfill and weekly-incremental modes, writing per-week files merged into a single queryable all_records.json that skips weeks already scraped. At the client snapshot this archive held over 2,100 IDSP outbreak records spanning roughly 57 weeks from January 2025, covering around 97 disease types across 35 states and union territories.
An access-controlled surveillance dashboard
A FastAPI app serves a single-page dashboard with an at-a-glance KPI row, a live source-health bar for all seven sources, per-source cards, and searchable drill-down modals built with Chart.js. The IDSP modal offers a searchable outbreak table, disease-breakdown charts, and a week-history grid; the ICMR modal tracks strains across selectable 16, 52, or 104 week windows; NCDC, WHO, and Power BI each get tailored detail views. The page auto-refreshes as new data lands.
Production-grade auth, admin, and operations
Session-cookie authentication with bcrypt hashing, single active session per user, and httponly cookies gates the sensitive data endpoints, with all access written to an audit log. An admin panel handles user management with admin and viewer roles, a capped user count, and self-account protections. An embedded APScheduler re-runs the full pipeline every 4 hours and the IDSP weekly job every Friday, and the app is deployed on Railway with SQLite or PostgreSQL portability.
How it works
- 1
Collect. On each source's natural cadence, the orchestrator runs the seven BaseScraper subclasses. Each fetches its source, parses it into a standardised record dict (name, status, data_type, record_count, last_updated, and data), and saves the result. Government PDFs, the ICMR JavaScript dashboard, JSON alert endpoints, and the Power BI embed are each handled by the technique that source requires.
- 2
Normalise and persist. Shared helpers handle pathogen keyword detection across roughly 25 diseases, 28-state alias normalisation, multi-format date parsing, and India keyword filtering, so every source emits a consistent shape. Each result is written twice: to a DB cache table (SQLite by default, PostgreSQL when configured) and to a local JSON file, while IDSP additionally maintains its merged week archive.
- 3
Stay resilient. BaseScraper.run never raises; a failing source returns an error payload, and the orchestrator transparently swaps in the last-known-good DB cache for that source, marking it 'Online (cached)'. Health checks recognise that Indian government sites time out from the US-based host and fall back to cache-based health instead of a live ping, so one dead source never blanks the dashboard.
- 4
Serve and refresh. FastAPI serves the combined data behind session-cookie auth, while APScheduler re-runs the full pipeline every 4 hours plus a Friday IDSP job. The dashboard polls status (every 12 seconds while scrapers run, settling to a 5-minute heartbeat when idle) and silently re-renders KPIs, cards, and modals whenever newer data appears.
The outcome
EpiCommand India replaced manual, multi-site collection with a single live screen. It is a fully automated, zero-touch surveillance platform consolidating seven authoritative sources behind one access-controlled login, with a longitudinal IDSP archive of over 2,100 outbreak records across roughly 57 weeks and snapshot coverage of around 97 diseases and 35 states and union territories. Resilient fault isolation with last-known-good cache fallback keeps the board populated even during source outages, and the embedded scheduler keeps everything current without human intervention. One honest note on scope: there is no AI or ML inference in the codebase itself; the platform's value is in robust automated collection, normalisation, archival, and visualisation, not in model-based prediction.